Three-Piston Radial Water Pump
Design, fabrication, and test from raw stock in one semester
- Role
- One of four part designers on a seven-person team — housing, base, and centre spinner
- Status
- Built & Tested
Headline results
Brief and constraints
Design, machine, and test a working water pump from raw stock in one semester. Deliver at least one litre per minute, stay inside a fixed envelope, and stay inside a $75 materials budget. Every part had to be made by the team on manual mills and lathes, or laser cut.
I was one of four part designers on a seven-person team. My assignment was the housing and base — the structure that locates three cylinders, the crank, and the drive shaft relative to one another — and I produced the detail drawing for the centre spinner that drives the piston rods.
Architecture trade study
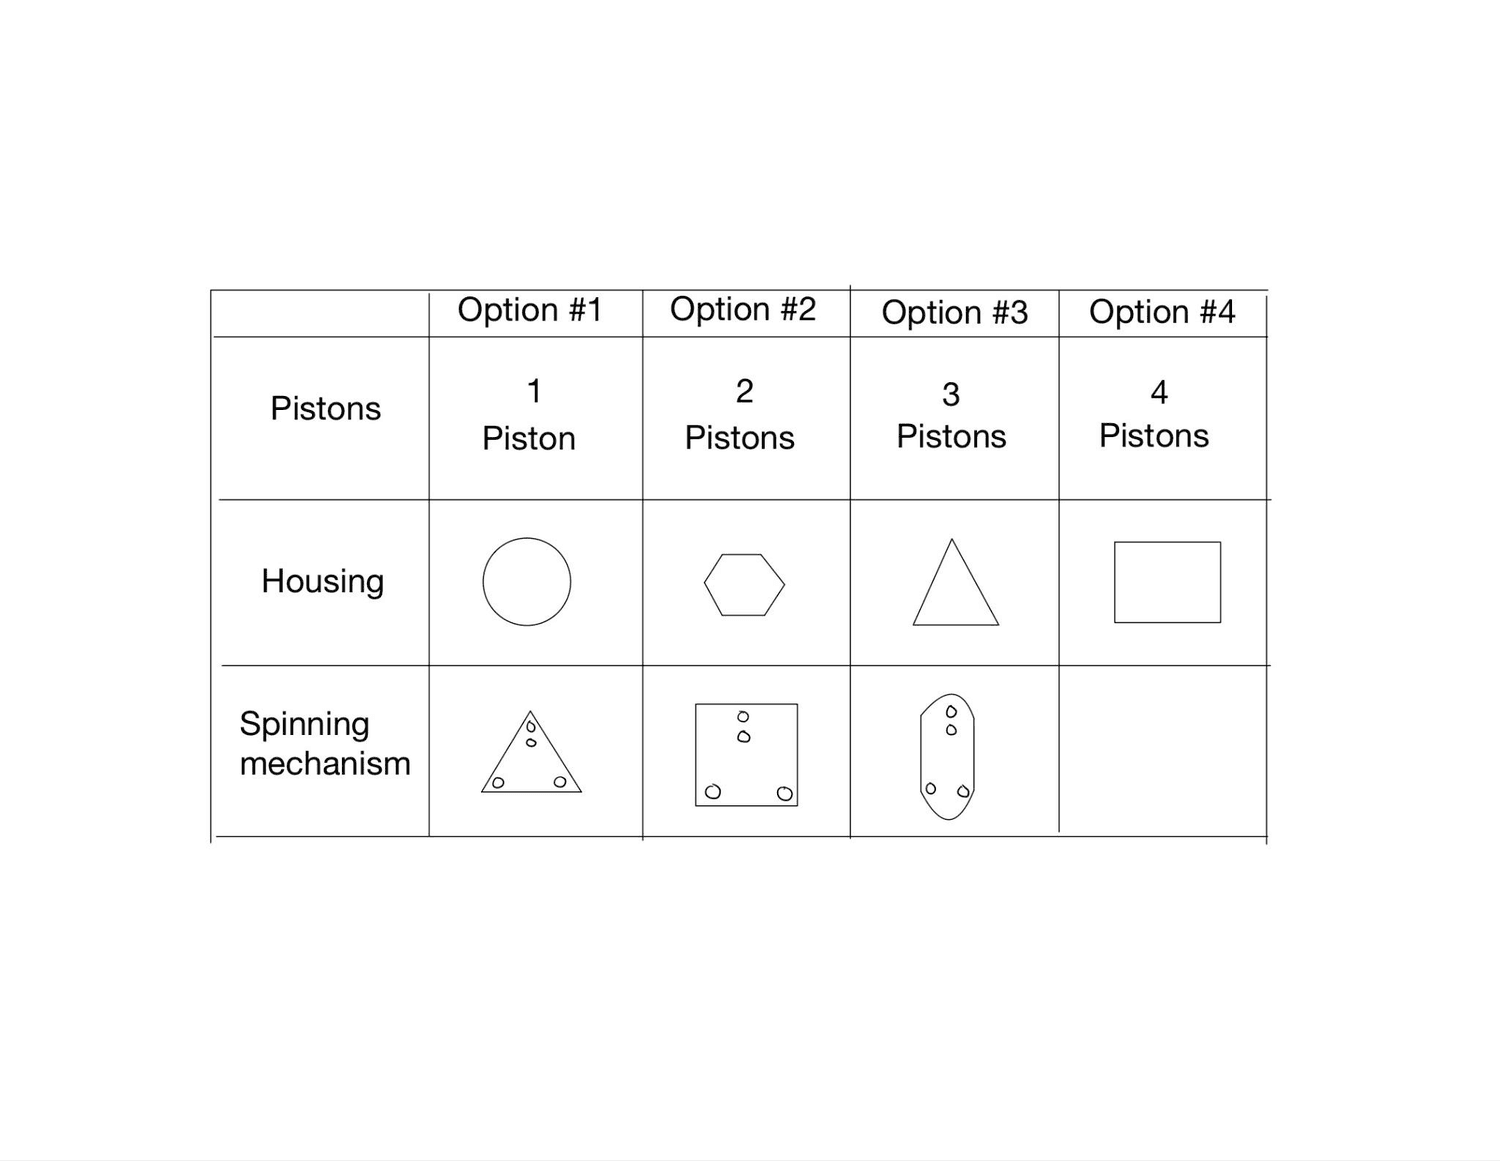
| Architecture | Attraction | Why it lost |
|---|---|---|
| Centrifugal | Very high flow, few moving parts, no valves, compact. | Almost no suction head — must be primed or submerged. Risk of not lifting from the reservoir at all. |
| Gear (external) | High speed and pressure, wide material choice. | Damaged by dry running. We wanted to dry-test the mechanism before test day. |
| Peristaltic | No fluid contact, no back-flow, precise per revolution. | Flow rate too low to clear the 1 L/min bar with confidence. |
| Radial piston (selected) | Positive displacement: flow set by geometry, not by head. Self-priming, high pressure, piston count is a free variable. | Physically large, and the count drives the envelope — which is what pushed us to three. |
How it moves fluid
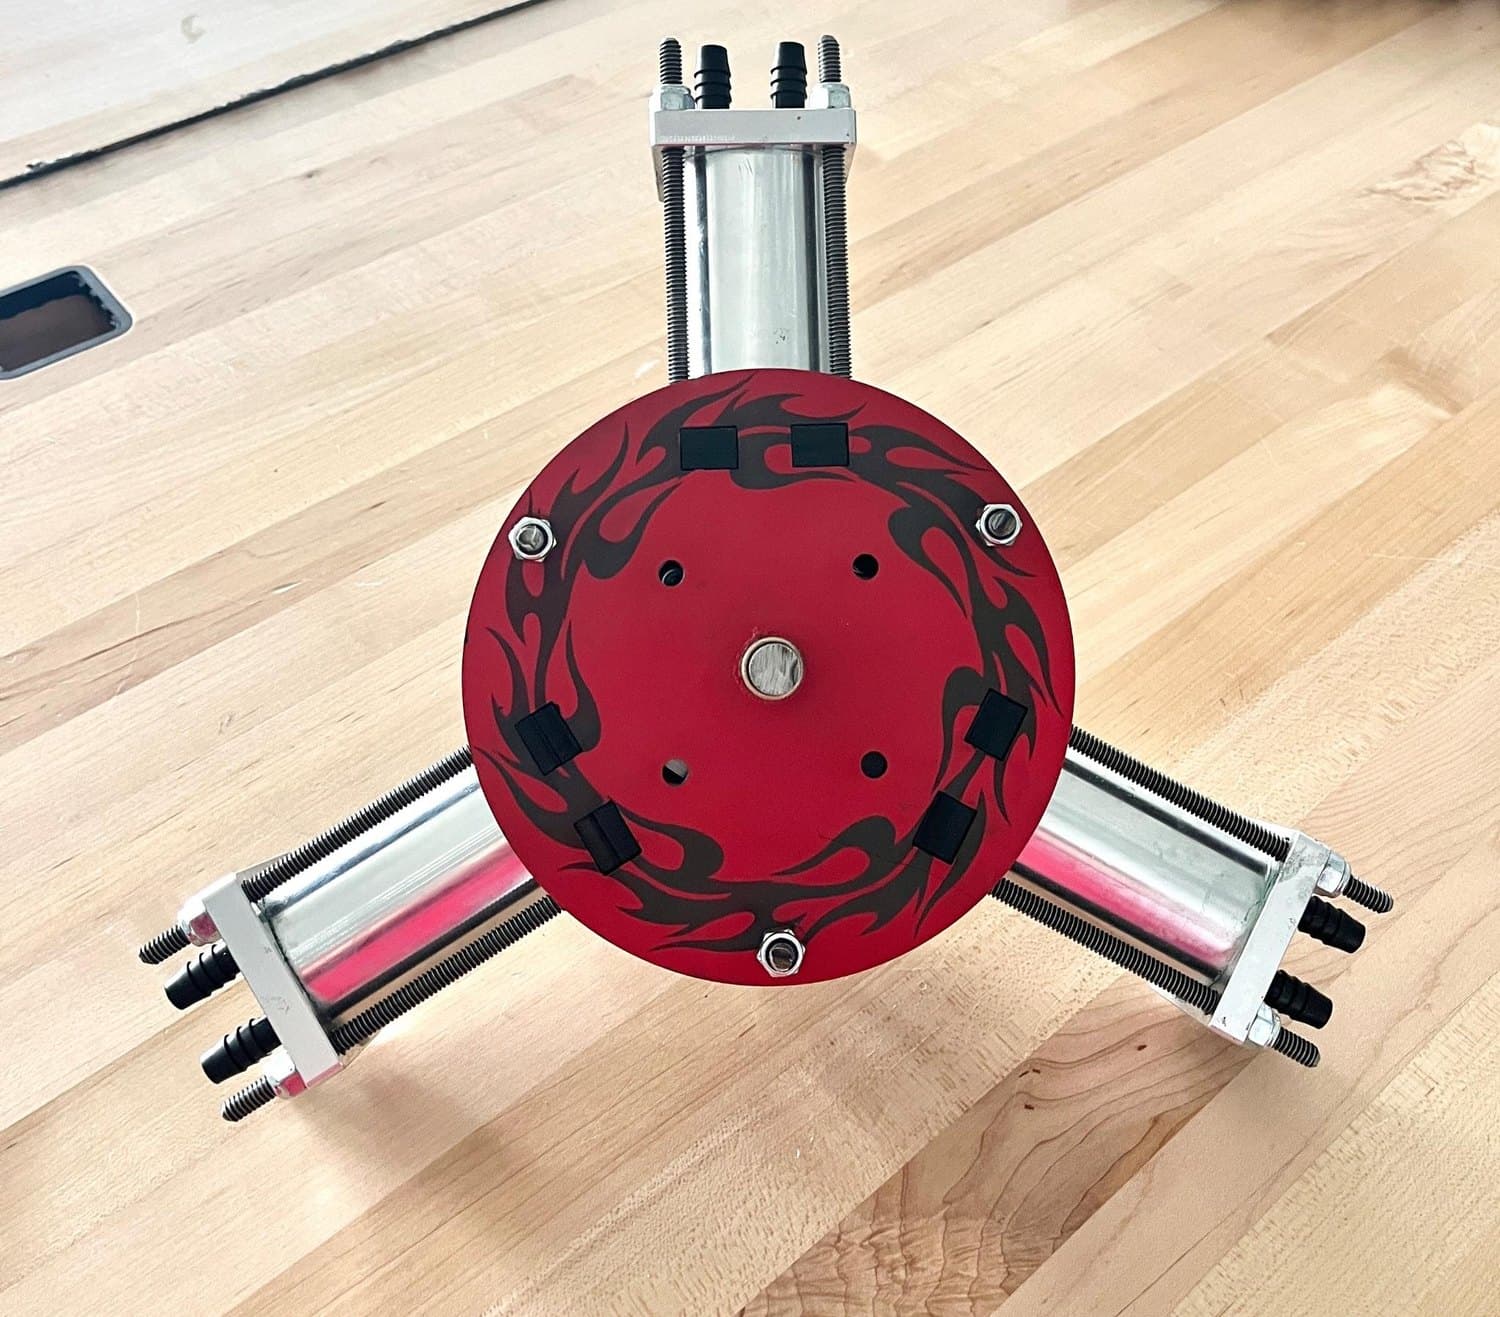
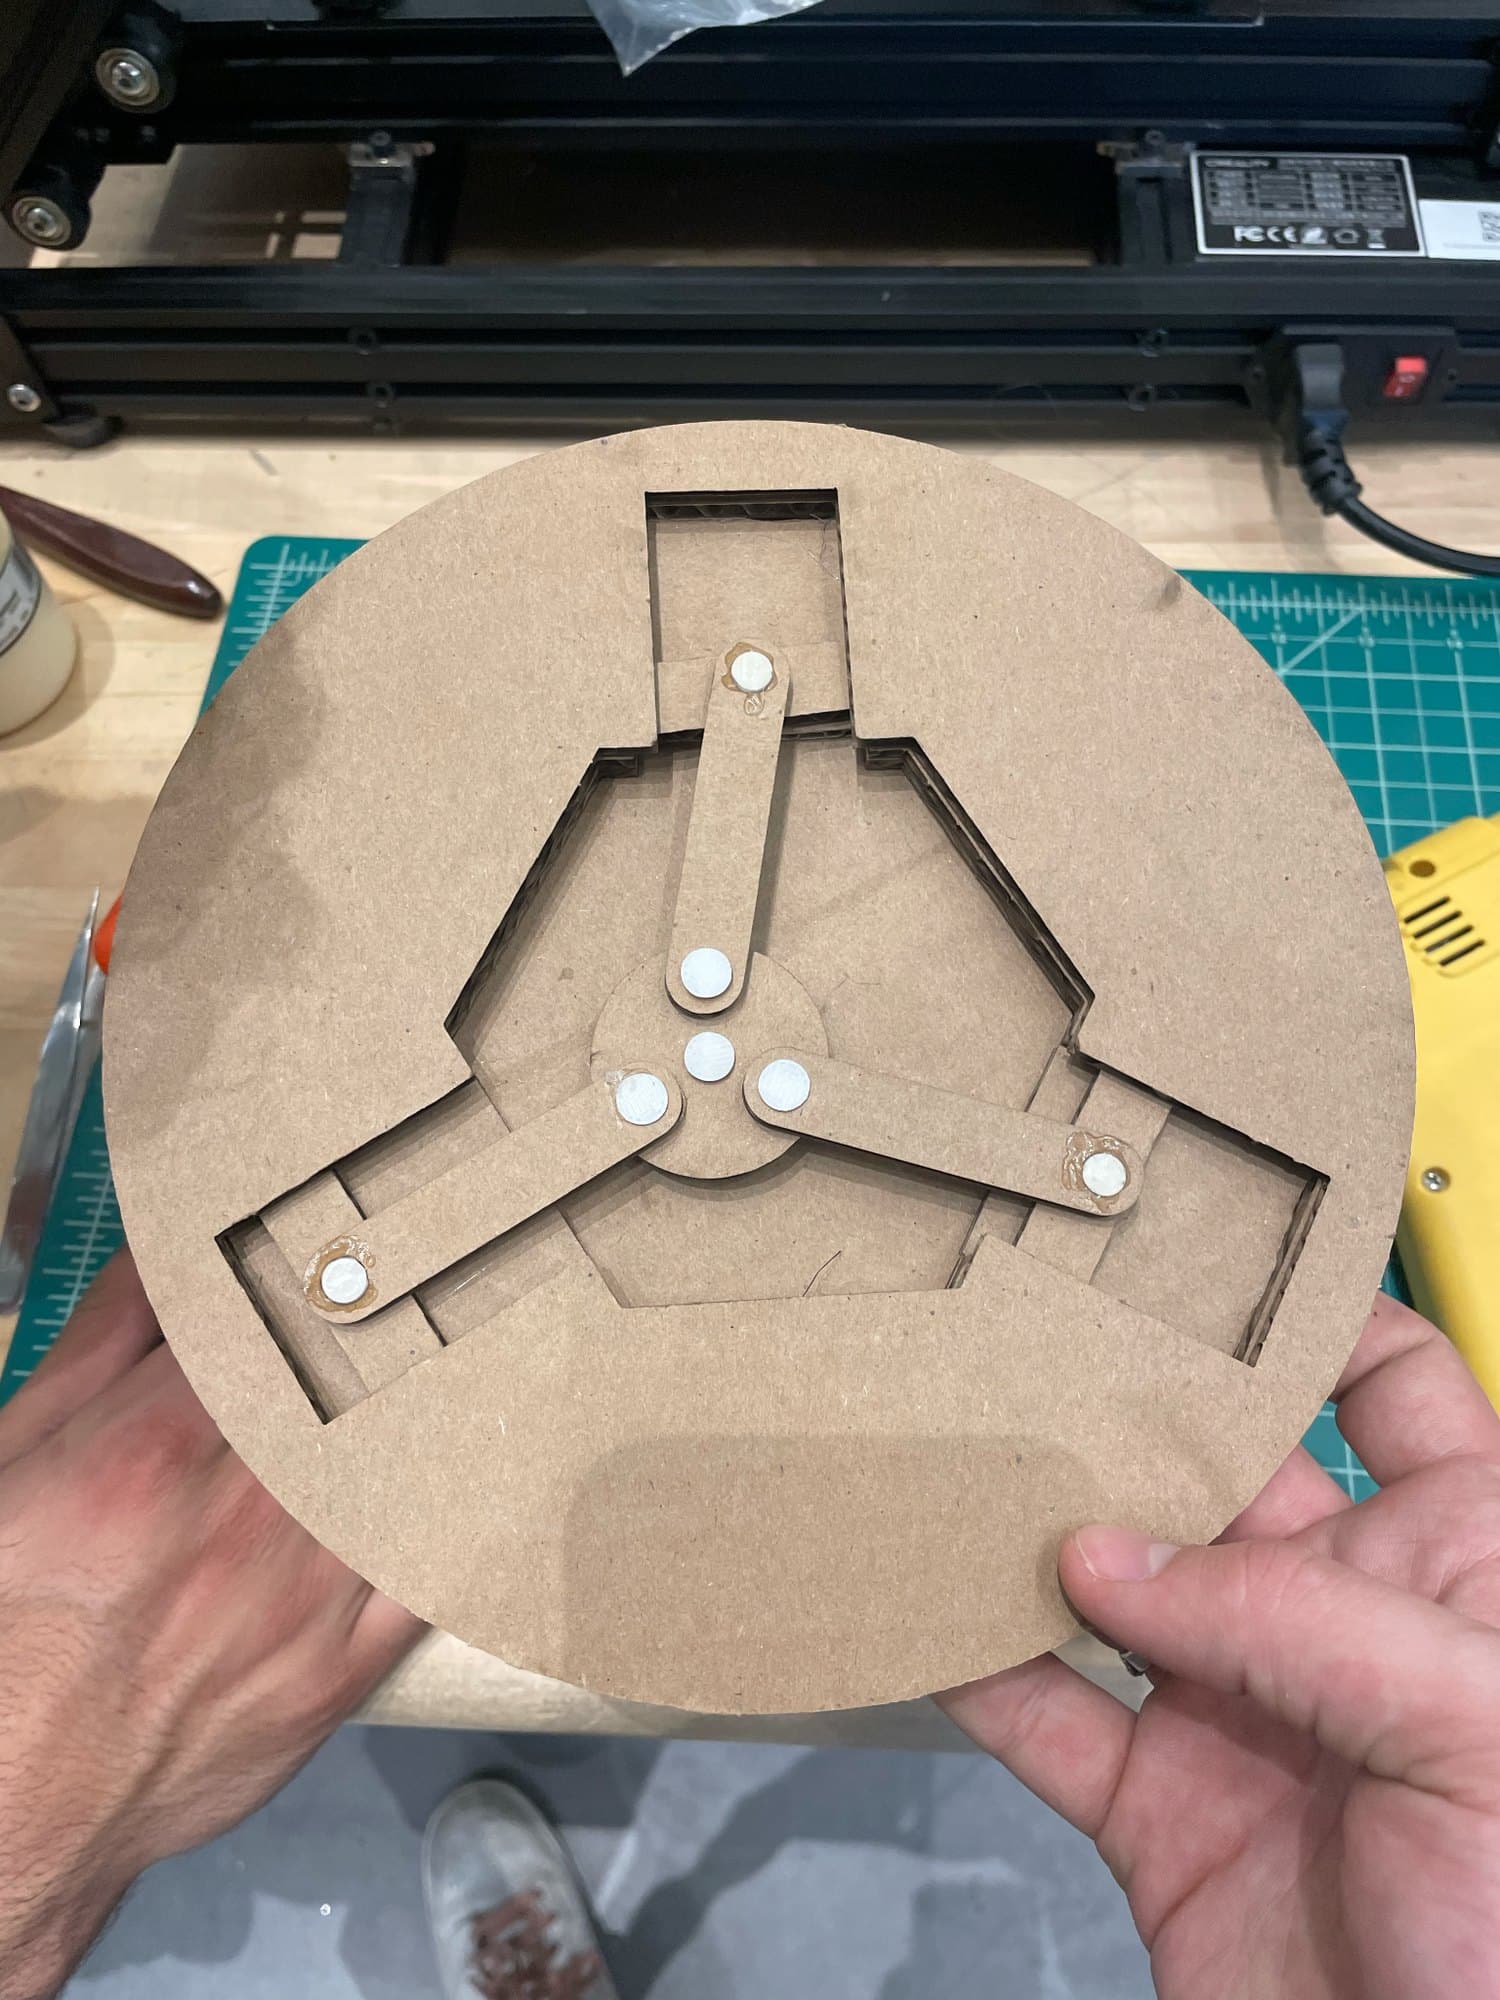
Three cylinders sit at 120° around a central shaft. Each piston rod is pinned to a rotating centre assembly, so every cylinder is a slider-crank sharing a common crank throw. One shaft revolution drives each piston through one complete out-and-back stroke: the outward half opens the cylinder and draws water in, the inward half closes it and pushes water out.
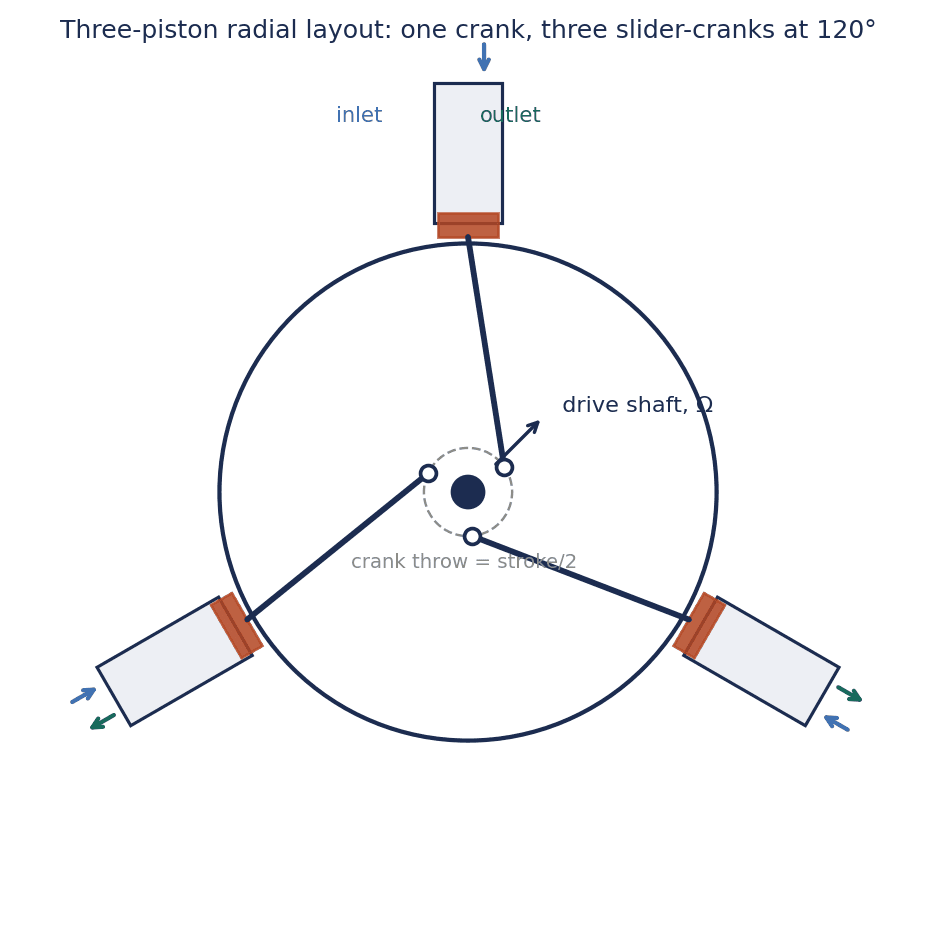
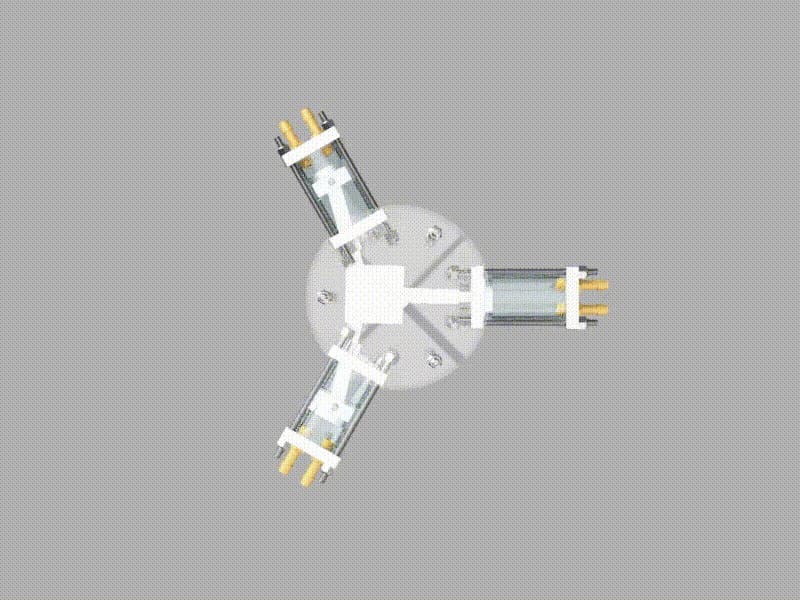
Because only pistons on their discharge stroke contribute, total flow is a sum of clipped half-sinusoids. That sum is what sets both the mean delivery and the pulsation, and it is the reason piston count is a design decision rather than a preference.
Why three pistons
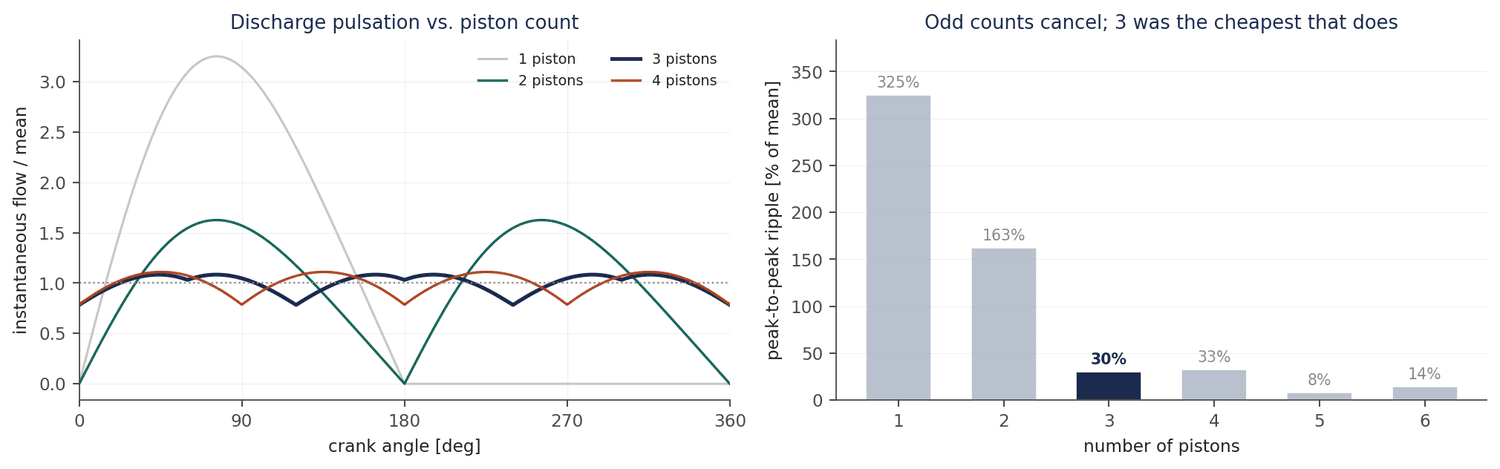
Adding pistons buys smoother flow and costs envelope, parts, and machining hours. Evaluating the flow sum across piston counts shows the return is strongly non-monotonic: odd counts interleave their discharge strokes so that one piston is always near peak velocity while another is near zero, while even counts pair pistons in phase opposition and leave a gap.
Three is the first count that brings pulsation into a usable band — from 325% peak-to-peak for a single piston down to 30% — and going to four actually makes it slightly worse while adding a fourth cylinder, rod, and set of fittings. Five would halve the ripple again, but at nearly twice the parts and an envelope we could not fit. Three was the cheapest count that solved the problem.
Sizing: drivetrain, displacement, and power
The bench motor delivers 0.75 hp at 900 rpm with 4.5 lb-ft of full-load torque. A 9:70 sprocket pair trades speed for torque into the pump crank. Checking the pair for consistency, T·ω at the crank returns 0.77 hp against 0.75 hp at the motor — the reduction conserves power to within the rounding on the torque figure, which confirms the ratio was applied in the right direction.
| Parameter | Value | Source |
|---|---|---|
| Bore × stroke | 1.78 in × 2.00 in | stock tube, crank throw |
| Pistons | 3 | pulsation analysis |
| Crank speed | 116 rpm | 9:70 reduction from 900 rpm |
| Test head | 1.5 m | bench configuration |
The predicted 28.3 L/min is 28× the requirement, which was deliberate: it left room to lose flow to leakage and still pass. Hydraulic power against the 1.5 m test head works out to 6.9 W — about 1.2% of the 0.75 hp going in. That figure is worth reading carefully rather than as an efficiency verdict: static lift at 1.5 m is only about 2 psi, so at these speeds the pump is barely working against gravity at all. Nearly all the shaft power goes into piston friction, leakage past unsealed piston heads, and driving water through restrictive 3/8 in barbed fittings.
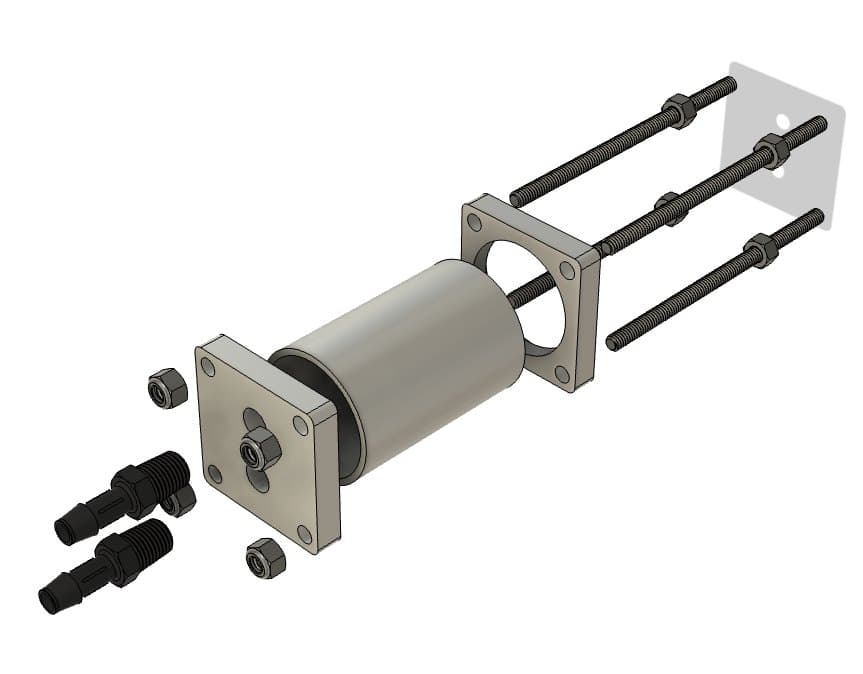
My parts: housing, base, and centre spinner
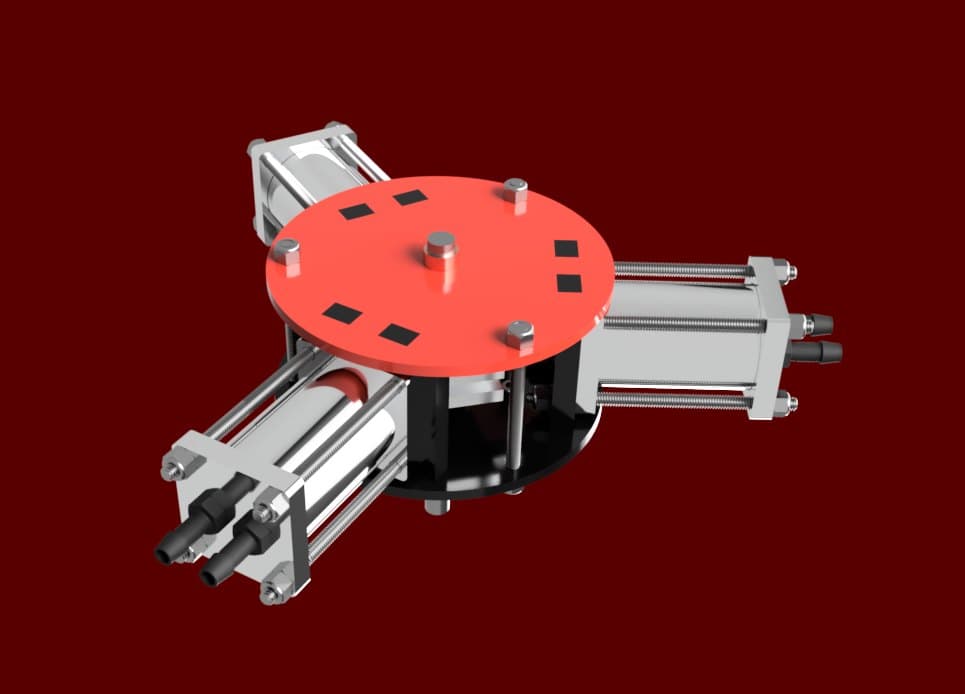
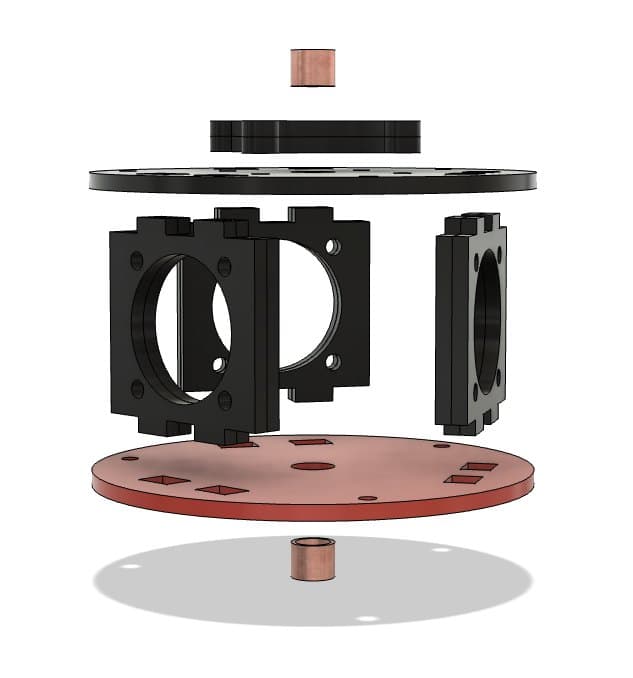
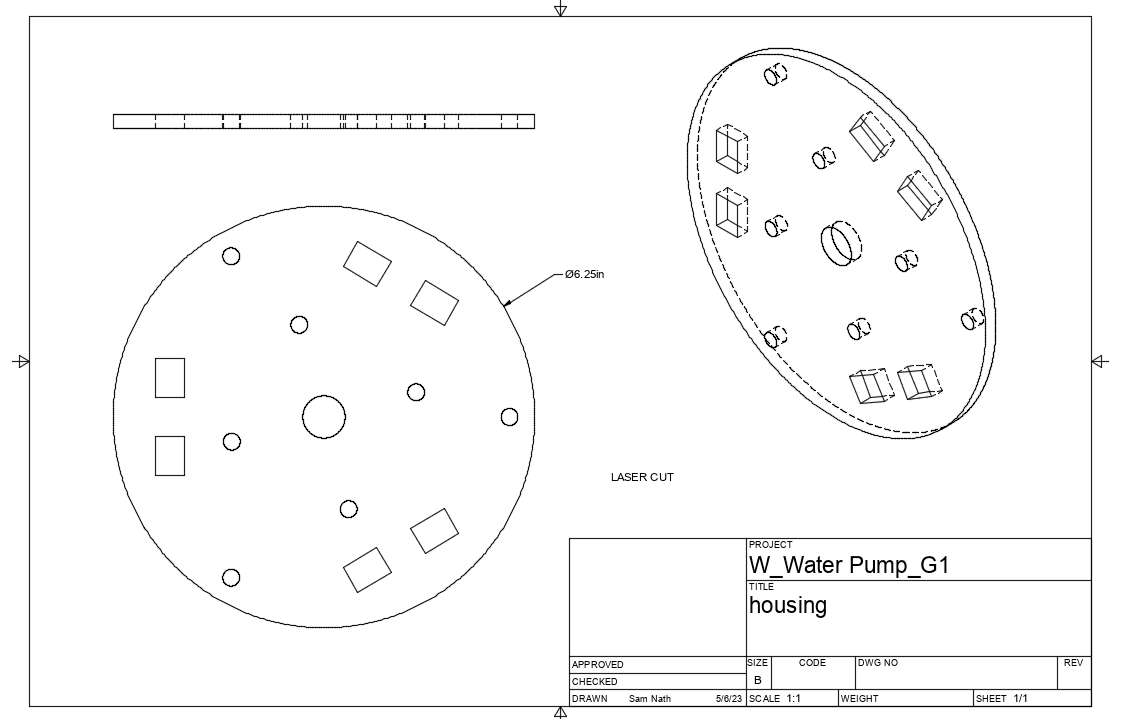
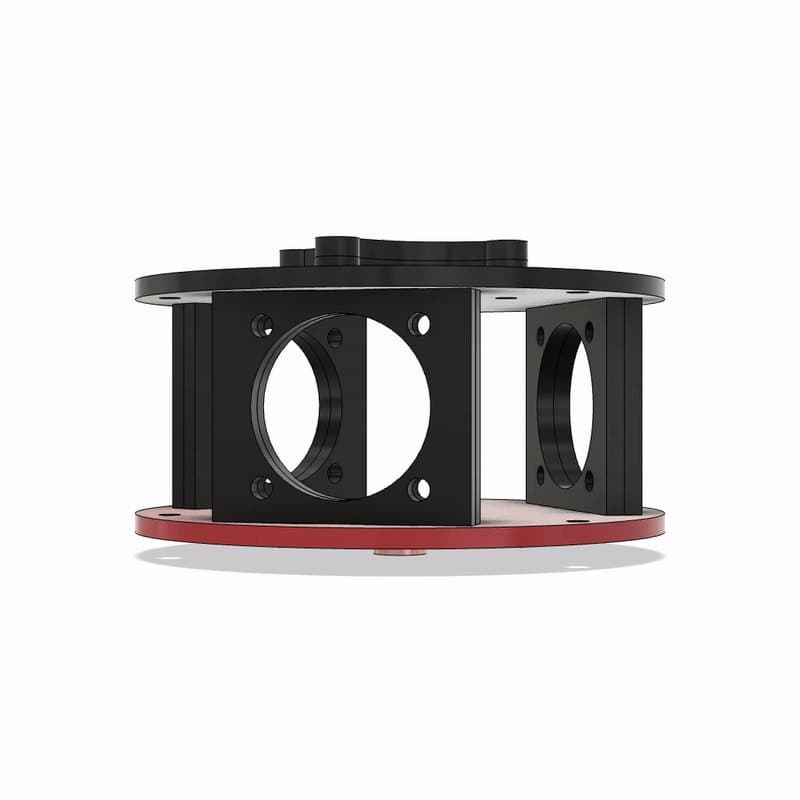
The housing is the part that has to hold everything else in the right place. Three cylinders have to stay square to the crank pin circle under load, the drive shaft has to stay concentric through two bushings, and the whole thing has to come apart for assembly. I built it as a set of interlocking laser-cut acrylic plates — a top disc, a bottom disc, and three side-wall frames that tab into both — so the geometry is fixed by the cut file rather than by how carefully someone drilled it.
Choosing acrylic over the aluminium alternative was a budget decision that paid twice: it dropped the housing cost to roughly $6 of sheet, and it let us cut and re-cut the plates in an afternoon when a dimension needed adjusting. Aluminium would have meant hours of mill time per iteration.
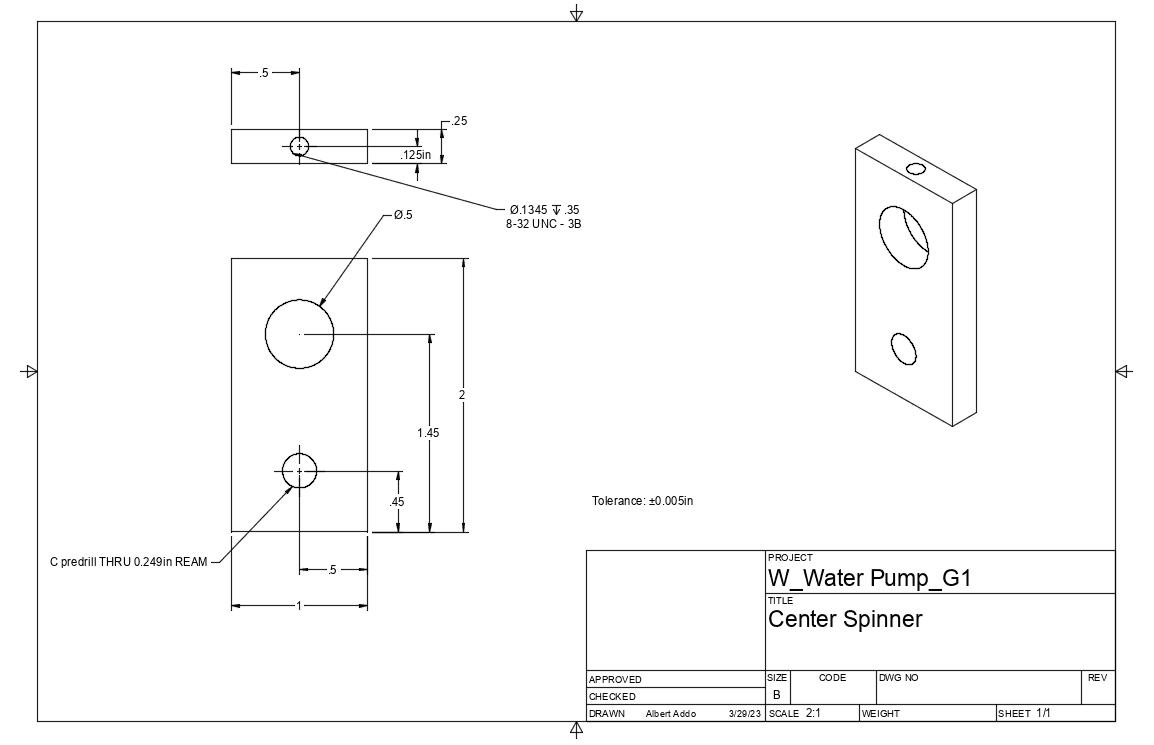
The centre spinner converts shaft rotation into the crank pin motion the three rods follow. It carries a reamed 0.249 in bore for the crank pin and a 0.5 in bore for the shaft, both toleranced to ±0.005 in — because the pin circle radius sets the stroke directly, and an error there shows up as a flow error on every stroke of every piston.
Test results and failure analysis
The pump was dry-run first with the motor coupled and no water, confirming the linkage turned freely through a full revolution. It then ran twice on the bench, at roughly half speed and at full speed. Both runs cleared the one litre per minute requirement comfortably. Neither came close to the swept-volume prediction.
| Run | Predicted | Delivered | Volumetric efficiency |
|---|---|---|---|
| ~60 rpm | 14.7 L/min | 5.9 L/min | 40% |
| 116 rpm | 28.3 L/min | 7.5 L/min | 27% |
A volumetric efficiency of 40% means three of every five cubic inches swept never reached the outlet. Two paths account for it. The piston heads ran directly in the bored tubes with no ring or O-ring, so each compression stroke pushes some fraction of its charge back past the piston; and the pump has no check valves, relying on hose routing alone to set flow direction, so the intake path is never positively closed during discharge.
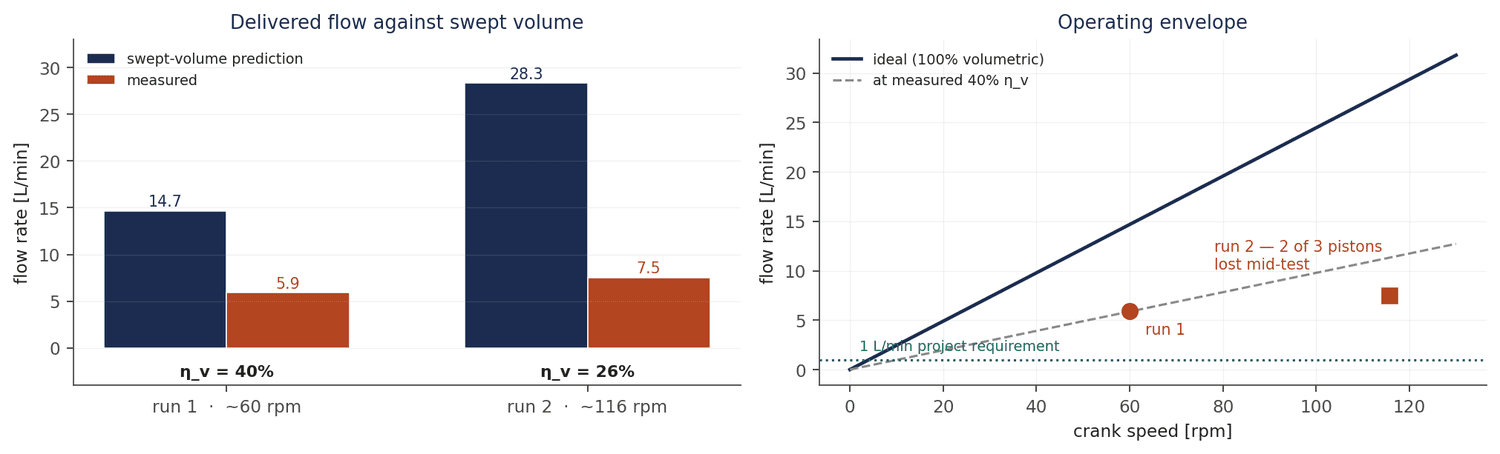
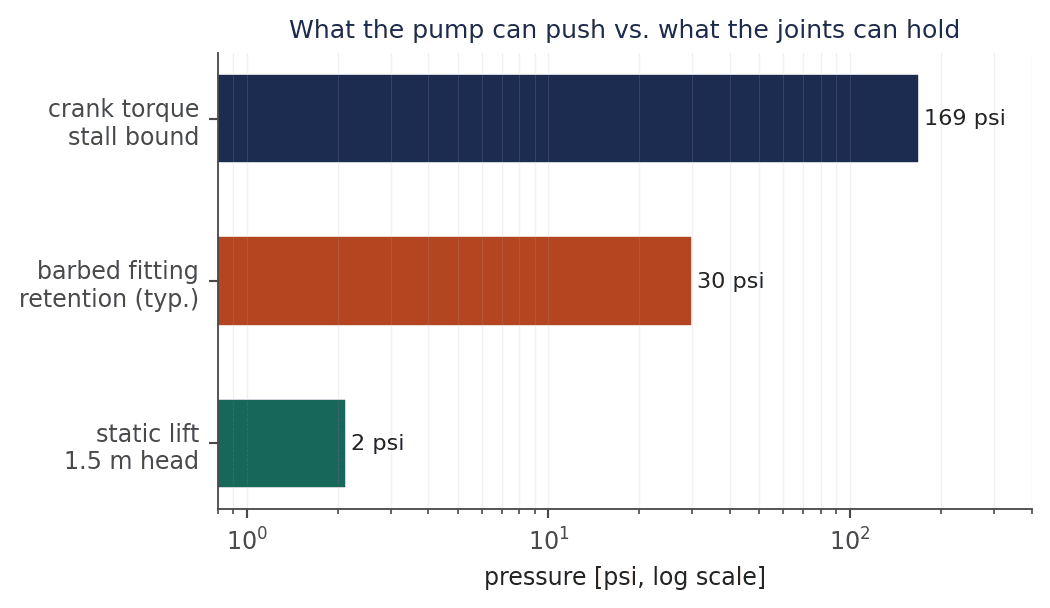
On the second run the intake hoses blew off their fittings, and outlet water fed back into the intake. By the end of the minute two of three cylinders were disconnected and the pump was running on one piston. The root cause is a pressure mismatch the sizing analysis makes visible: 35 lb-ft at the crank acting through a 1 in throw puts on the order of 420 lbf behind a 2.49 in² piston — a stall bound near 170 psi. A positive-displacement pump does not care what pressure it takes; it will deliver its swept volume and raise pressure until something yields. With flow forced through 3/8 in barbed fittings into soft tubing with no hose clamps, the weakest link was barb retention, an order of magnitude below what the crank could generate.
Cost, outcome, and what I would change
Materials came in at $53.11 ordered against a $75 budget, with $40.51 actually consumed. But materials are not where a prototype's cost lives.
| Line | Basis | Cost |
|---|---|---|
| CAD and design | 5 h @ $120/h | $600.00 |
| Machining and laser cutting | 14 h @ $40/h | $560.00 |
| Materials consumed | as-built bill of materials | $40.51 |
| Machining operations | 53 ops @ $1.20 | $63.60 |
| Product cost, one-off | — | $1,264.11 |
| Product cost at 1,000 units | NRE amortised over the run | $64.80 |
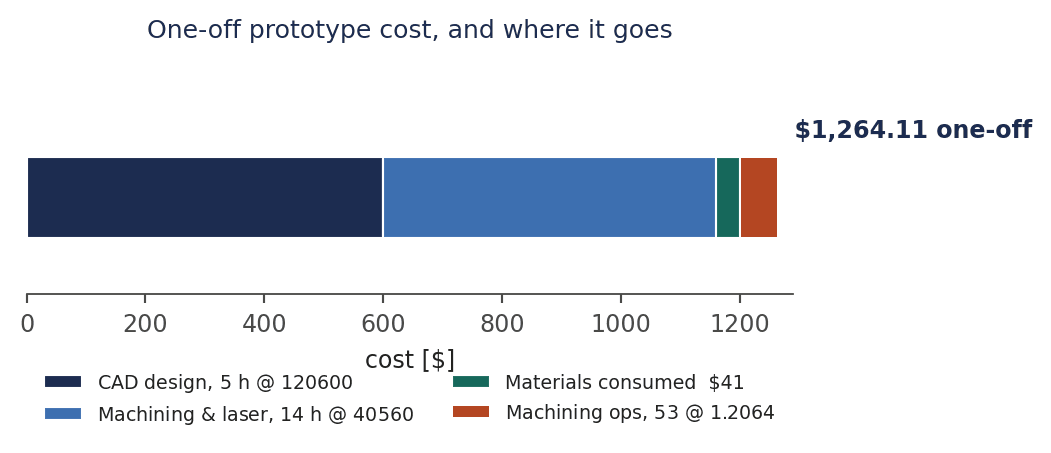
The interesting number is the last one. At a single unit, 95% of the cost is non-recurring engineering — design and setup time that gets paid once. Amortise that over a thousand units and cost per pump collapses by a factor of twenty to the machining operations and the bill of materials. It is a compact illustration of why parts count and operation count, not material price, are what a production design gets optimised against.
- 01Seal the pistons. An O-ring groove in the piston head is one extra lathe operation and is the single largest recoverable loss.
- 02Fit check valves. Relying on hose routing to set flow direction leaves the intake open during discharge and makes back-feed possible the moment pressure rises.
- 03Clamp or thread the hose joints. The barbed fittings were the weakest element in a circuit whose driver can reach ~170 psi; that mismatch was foreseeable from the torque figure before test day.
- 04Instrument the outlet. We measured a single volume over a minute, which cannot separate leakage from the mid-test failure.
- 05Check the pressure capability of every element in the circuit, not just the pump. The sizing analysis predicted flow well; nobody carried the torque figure through to a pressure and compared it against the fittings.